What live security operations
actually look like.
Real, anonymised numbers from operations running on Pulse — not survey answers, not estimates. Measured over the trailing 90 days and updated quarterly. As the founding cohort grows, so does the dataset.
Proof at scale
is normal here.
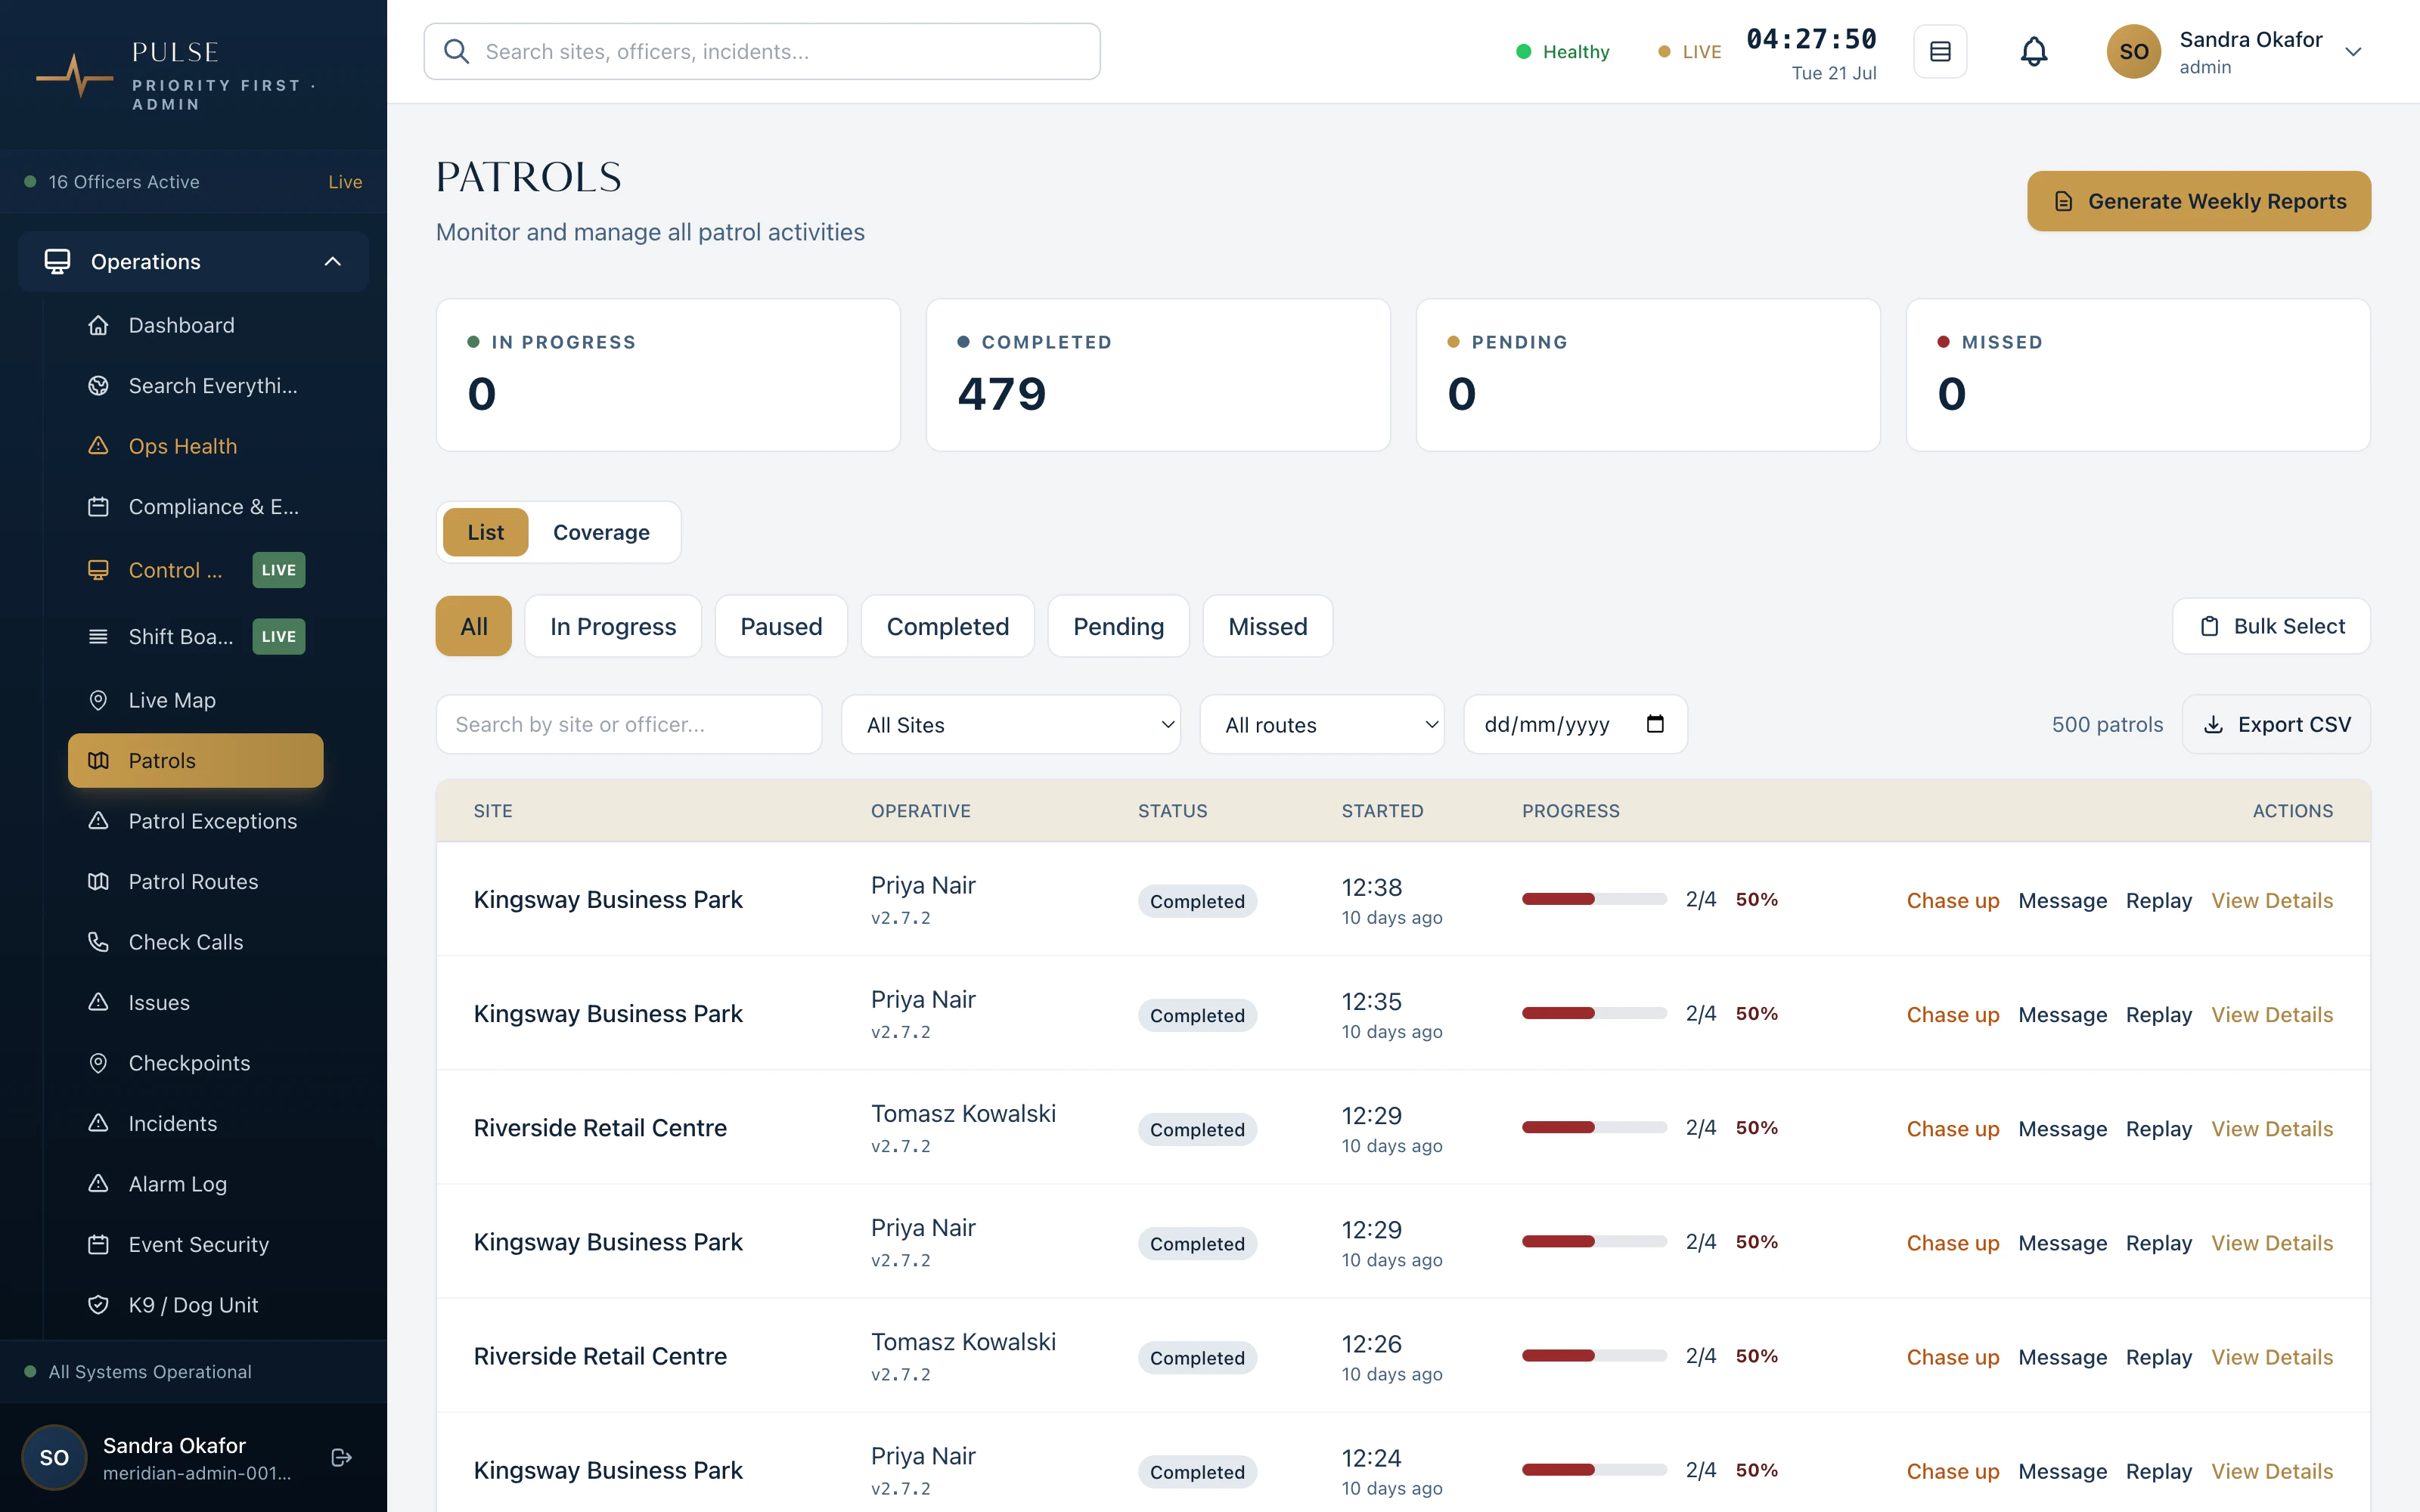
Across the 22 sites patrolled in the window (24 are live — two onboarded so recently they haven’t started patrols), virtually every checkpoint on every patrol is backed by a photograph — watermarked with the officer, site, GPS position and time. The 3.8% that aren’t photo-backed are visible too: honest numbers mean the gaps show, which is exactly how they get closed.
How this is measured
Figures are computed directly from live operational records on the Pulse platform over the trailing 90 days to 20 July 2026: completed patrols, the checkpoints verified within them, and whether each checkpoint carries photographic evidence. Data is aggregated across all production operations, anonymised, and excludes demonstration environments. This is v1 of a quarterly series — as more operators join the founding cohort, future editions will add coverage-vs-contract rates, incident response times and per-sector splits. If you’d like your operation benchmarked against these numbers, book a demo and we’ll run the comparison with you.