
Last updated: 18 November 2026
Facilities management KPIs are the measurable targets — covering cost, compliance, helpdesk response and sustainability — that tell a client whether an FM contract is being delivered as promised. Common examples include PPM completion rate, mean time to resolve reactive calls, statutory inspection compliance, and energy use per square metre, each tracked against an agreed SLA.
Key Takeaways
- The industry median planned maintenance (PM) compliance rate is 72%, against a top-quartile benchmark of 91%, according to Oxmaint's IFMA/BOMA benchmarking analysis (2025).
- Emergency repair work costs 4.8 times more than planned maintenance per repair event, per Oxmaint (2025).
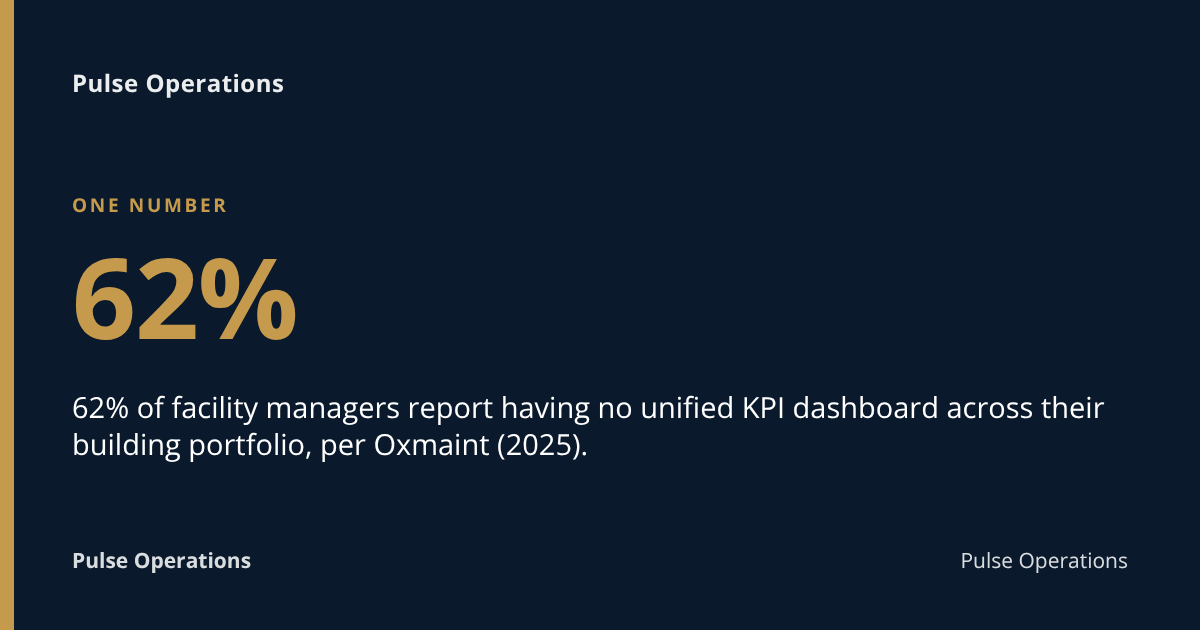
- 62% of facility managers report having no unified KPI dashboard across their building portfolio, per Oxmaint (2025).
- A PM completion rate of 89% is achievable with CMMS (computerised maintenance management system) versus a 51% industry average without automated scheduling, per Oxmaint (2025).
- A Facility Condition Index below 0.05 signals good building condition; above 0.10 signals poor condition requiring urgent capital spend, per Oxmaint (IFMA/BOMA) (2025).
What are facilities management KPIs?
Facilities management KPIs (key performance indicators) are quantified targets set out in a contract or SLA (service level agreement) that measure whether hard and soft FM services are being delivered to the standard a client is paying for. They convert vague promises — "good cleaning", "fast response" — into numbers that can be checked, reported and disputed with evidence rather than opinion.
In a typical UK contract, KPIs sit inside or alongside the SLA and feed into a payment mechanism: miss a target repeatedly and the provider may face service credits or a performance review; hit it consistently and the relationship renews without a fight. The Institute of Workplace and Facilities Management (IWFM), the UK's professional body for the sector (formerly BIFM), treats KPI and SLA design as a core competency for estates and FM managers.
The most common categories are cost (cost per square foot, cost per work order), compliance (statutory inspections, certification currency), helpdesk (response and resolution times), hard FM delivery (PPM completion, first-time fix), soft FM quality (cleaning and security audit scores), and sustainability (energy and water use, waste diversion). A well-run contract tracks a handful from each category rather than dozens from one.
Hard FM service KPI examples: PPM completion and asset condition
Hard FM KPIs measure the physical, engineering side of a building — mechanical, electrical, fire, lift and plant maintenance — against planned schedules and breakdown rates. The headline metric is PPM (planned preventative maintenance) completion rate: the percentage of scheduled maintenance tasks actually carried out on time.
The gap between good and average performance here is stark. Industry median PM compliance sits at 72%, while top-quartile operators hit 91%, according to Oxmaint's IFMA/BOMA benchmarking (2025). Separately, Oxmaint (2025) reports that CMMS-driven scheduling can lift PM completion to 89%, against a 51% average where scheduling isn't automated — a gap that largely explains why reactive costs balloon on under-managed contracts.
Common hard FM KPIs include:
- PPM completion rate — percentage of scheduled tasks completed within the window
- Reactive-to-planned ratio — the split between emergency callouts and planned work; a healthy contract leans planned, since Oxmaint (2025) puts emergency repair cost at 4.8 times the cost of planned maintenance per event
- Facility Condition Index (FCI) — total deferred maintenance cost divided by current replacement value; IFMA classes below 0.05 as good condition, 0.05–0.10 as fair, and above 0.10 as poor, requiring urgent capital intervention, per Oxmaint (IFMA) (2025)
- Statutory compliance rate — percentage of legally required inspections (fire alarm testing, lift LOLER checks, gas safety) completed on schedule
- Mean time to repair (MTTR) — average time from fault report to fix
Letting PPM slip is expensive in a way most boards don't see until the backlog is large: Oxmaint (2025) notes the US public-sector deferred maintenance backlog has reached $176 billion, growing 7% annually without structured preventive programmes — a direct warning about what happens when "we'll get to it" becomes the default.
Soft FM service KPI examples: cleaning, security and reception quality
Soft FM KPIs measure services delivered by people rather than plant — cleaning, security, reception, catering and grounds maintenance — typically through scored inspections rather than pure uptime data. Because soft FM is harder to measure objectively than a boiler cycling on schedule, most contracts use structured audit scoring: a checklist walked monthly or quarterly, with each area given a percentage pass rate against an agreed standard.
Typical soft FM KPIs include a cleaning audit score (percentage of checked areas meeting the agreed standard, often benchmarked against BS EN 13549 cleanliness assessment principles), a security patrol completion rate, incident response time, mystery-shopper or tenant satisfaction scores, and uniform/presentation compliance. For security specifically, the metric that actually matters to a client isn't "did the guard say a patrol happened" — it's whether there's evidence the checkpoint was walked at all.
This is the exact gap Pulse Operations was built to close. On a landmark West London mixed-use development — retail, residential, plant rooms and service yards along one of the area's best-known streets — Priority First (a sister company: it has the same majority owner as Aether Agency Ltd, which runs Pulse) had no way to prove which plant room was actually checked at 3am. Pulse Operations made all 152 checkpoints photo-mandatory: every checkpoint completed by a mandatory watermarked photograph showing officer, site, GPS and time, with no NFC or QR tag scanning involved by design. A missed area now shows as a gap in the record immediately, not a dispute raised six weeks later. The site has run that way since February 2026, logging over 540 patrols in the first five months, with 11 officers inducted onto one system (production data, as of July 2026). Across live Pulse operations generally, 96.2% of checkpoints carry a watermarked photo over a trailing 90-day period, as of July 2026 — see the full benchmark for method and sample.
Setting realistic KPI targets and SLAs for a UK FM contract
Realistic KPI targets are set by benchmarking the service against achievable industry norms, then building in a tolerance band rather than a single pass/fail line, so the contract survives a bad week without falsely signalling failure. Copying a competitor's headline figure or picking a round number ("99% uptime") without checking it against the building's age, asset condition or staffing model is the single most common cause of SLA disputes.
Start from the Facility Condition Index of the estate: a building scoring above 0.10 on FCI is, per IFMA's own classification, already in poor condition requiring urgent capital intervention — setting a 95% PPM completion target on that estate without first addressing the backlog sets the contractor up to fail on a problem they didn't create. A more realistic approach ties the target to the current baseline plus an improvement curve: if a site is at 72% PM compliance (the industry median, per Oxmaint, 2025), a first-year target of 80–85% is achievable; jumping straight to the 91% top-quartile figure in year one usually isn't, without new tooling or headcount.
| KPI | Typical starting target | Stretch target (with CMMS/platform) |
|---|---|---|
| PPM completion rate | 80–85% | 89–91% |
| Helpdesk response time (urgent) | Within 1 hour | Within 15–30 minutes |
| Statutory compliance rate | 98% | 100% |
| Reactive-to-planned ratio | 40:60 | 20:80 |
| Cleaning audit score | 85% | 95%+ |
For security tenders specifically, a guide on winning a security tender notes that most formal UK tenders — especially public sector — are scored on a published price/quality split, commonly between 60/40 and 30/70. On a 40/60 split, a bid priced 5% higher that scores one grade better on quality wins comfortably, which is exactly why KPI evidence, not just KPI promises, decides contracts. Public-sector buyers now also operate under the Procurement Act 2023 regime, with its emphasis on transparency and selecting the "most advantageous tender" rather than simply the cheapest.
Who monitors and reports FM KPIs: client or provider?
Both parties typically share responsibility for FM KPI monitoring, but the contract should name one party as the system of record to avoid disputes over whose numbers are correct. In most UK outsourced contracts, the provider collects and reports the data monthly or quarterly, while the client (or their appointed consultant) audits a sample to verify it independently.
The honest answer is that whoever controls the evidence controls the conversation. If a security or cleaning contractor self-reports a 98% patrol completion rate from a paper sign-in sheet, the client has no way to check it — and that's precisely the position Priority First was in before Pulse Operations existed. Patrols were recorded on sign-in sheets, jobs passed around on WhatsApp, and expiries sat in a spreadsheet nobody fully trusted; when a client called at 7am asking "was everything OK last night?", there was no evidence to answer with, only reassurance. Pulse Operations gave every client a white-label client portal showing delivered-vs-contract numbers under the provider's own brand, including honest empty states where something genuinely wasn't done — removing the need to take anyone's word for it. As Mo Hassan, Managing Director of Priority First, put it: "We used to take everyone's word for it. Now every checkpoint has a photo and the client can see it before we've finished the shift — it's changed how we win work."
That arrangement — provider reports, client sees the underlying evidence directly rather than a summary — resolves most of the trust problem that otherwise makes KPI reporting adversarial.
Helpdesk and reactive maintenance KPIs: response and resolution time
Helpdesk KPIs measure how quickly an FM provider acknowledges, responds to and resolves a reported fault, typically split into two separate clocks: response time (time to first acknowledgement or attendance) and resolution time (time to actual fix). Conflating the two is a common reporting error — a provider who "responds" within 15 minutes but takes five days to resolve a leaking pipe hasn't delivered the service the client thinks they're paying for.
Core helpdesk KPIs include:
- First response time — time from ticket logged to first human acknowledgement
- On-site response time — time from ticket logged to an engineer physically attending, often tiered by priority (P1 emergency, P2 urgent, P3 routine)
- Resolution time — time from attendance to fault fixed or made safe
- First-time fix rate — percentage of jobs resolved on the first visit without a return trip
- Escalation rate — percentage of tickets that breach SLA and require management escalation
Oxmaint's (2025) figure that emergency repair work costs 4.8 times more than planned maintenance per event is the strongest argument for tracking reactive volume as its own KPI — a rising reactive-to-planned ratio is often the earliest warning sign that PPM is slipping, well before a statutory inspection is missed outright. Pulse Operations's facilities and work orders module tracks work orders with contractor costs, PPM schedules, helpdesk SLAs, permits and asset registers in one place, so the reactive-versus-planned split is visible without reconciling three separate spreadsheets.
UK compliance and health and safety KPIs to track
UK compliance KPIs measure whether statutory inspections and legal duties are actually being completed on schedule, not just whether a policy document says they should be. The baseline legal duty sits under the Health and Safety at Work etc. Act 1974, with specific inspection regimes layered on top: LOLER (Lifting Operations and Lifting Equipment Regulations 1998) for lifts, Gas Safety (Installation and Use) Regulations 1998 for gas appliances, and the Regulatory Reform (Fire Safety) Order 2005 for fire risk assessments — all enforced in the UK by the Health and Safety Executive (HSE).
Typical compliance KPIs include statutory inspection completion rate (percentage of legally required checks completed on time), certificate currency (percentage of compliance certificates not expired), training compliance rate for FM and security staff, and incident/near-miss reporting rate. For sites open to the public, readiness against the Terrorism (Protection of Premises) Act 2025 — commonly known as Martyn's Law — is increasingly a named quality question in FM and security tenders, per Pulse Operations's tender guide.
Security contractors have an additional layer: screening to BS 7858 (security screening of individuals employed in a security environment), licensing against the Private Security Industry Act 2001 through the Security Industry Authority (SIA), and — for ACS-approved contractors — annual reassessment against the SIA's Approved Contractor Scheme, which, per Pulse Operations's ACS evidencing guide, scores a business against 78 individual indicators across seven criteria including Service delivery and People. A compliance runway puts SIA licences, BS 7858 records, DBS checks, right-to-work documents, training and statutory building compliance on one expiries timeline, so a lapsed certificate shows up before an assessor or auditor finds it.
Comparing in-house and outsourced FM KPI measurement
An in-house FM team and an outsourced contract need fundamentally different KPI setups, because the accountability question is different — an in-house team reports to its own board, while an outsourced provider reports to a client who is actively checking whether they got what they paid for.
| Factor | In-house FM team | Outsourced FM contract |
|---|---|---|
| Primary KPI purpose | Internal budget and resource justification | Contractual performance and payment trigger |
| Who sets targets | Facilities manager, often informally | Negotiated into SLA/contract schedule |
| Consequence of a miss | Internal review, reallocation | Service credits, contract review, potential termination |
| Reporting frequency | Often ad hoc or annual | Usually monthly, sometimes quarterly |
| Independent verification | Rare | Increasingly expected, especially post-tender |
Oxmaint (2025) found that 62% of facility managers have no unified KPI dashboard across their portfolio — and that gap tends to be worse in-house, where KPIs were never contractually forced into existence, than in outsourced contracts where the SLA demands a report. The fix in both cases is the same: a single system of record rather than a KPI spreadsheet nobody trusts, which is the exact problem Pulse Operations solved for Priority First when security and FM moved onto one login, replacing four separate systems and a spreadsheet, scaling to 24 sites within six months of going live in February 2026 (as of July 2026).
Your facilities management KPIs checklist
- Pick no more than two or three KPIs per category (cost, compliance, helpdesk, hard FM, soft FM, sustainability) rather than tracking everything
- Set first-year targets against the site's actual baseline, not an industry top-quartile figure
- Separate response time from resolution time in every helpdesk SLA
- Put statutory inspection dates (LOLER, gas safety, fire risk assessment) on one visible expiries runway
- Agree who owns the system of record before the contract starts, not after the first dispute
- Require photo or GPS evidence for patrol and inspection-based KPIs, not a self-reported tick
- Review hard FM and compliance KPIs monthly; sustainability and benchmarking data can run quarterly
- Check the reactive-to-planned maintenance ratio every quarter — a rising trend usually means PPM is slipping
FAQ
What are examples of facilities management KPIs?
Common examples include PPM completion rate, mean time to resolve reactive repairs, statutory inspection completion rate, helpdesk first-response time, cleaning and security audit scores, and energy use per square metre. Most contracts track a handful from each of the cost, compliance, helpdesk and soft/hard FM categories rather than every possible metric.
What are the main KPI categories in facilities management?
The main categories are cost (cost per square foot, cost per work order), compliance (statutory inspections, certificate currency), helpdesk (response and resolution time), hard FM (PPM completion, FCI), soft FM (cleaning, security and reception quality scores), and sustainability (energy, water, waste). Each category typically has two or three headline metrics rather than dozens.
What is a good PPM completion rate?
Industry median planned maintenance compliance is 72%, with top-quartile performers at 91%, according to Oxmaint's IFMA/BOMA benchmarking (2025). A realistic first-year UK contract target usually sits between 80% and 85%, improving towards 90%+ once a CMMS or automated scheduling tool is in place.
How often should FM KPIs be reviewed?
Most UK FM contracts review helpdesk, hard FM and compliance KPIs monthly, with a deeper quarterly or annual review covering cost benchmarking and sustainability trends. Monthly review catches a slipping PPM schedule or rising reactive ratio before it becomes a statutory compliance failure.
Who is responsible for monitoring FM KPIs, the client or the provider?
The provider typically collects and reports KPI data as part of the contract, while the client (or an appointed consultant) audits a sample independently to verify it. Naming the system of record in the contract — whose data is the evidence of record — avoids disputes over whose numbers are correct.
What is the Facility Condition Index and why does it matter?
The Facility Condition Index (FCI) is deferred maintenance cost divided by current replacement value, used to classify a building's physical condition. IFMA classes below 0.05 as good condition, 0.05–0.10 as fair, and above 0.10 as poor condition requiring urgent capital intervention, per Oxmaint (IFMA/BOMA) (2025).
What's the difference between hard FM and soft FM KPIs?
Hard FM KPIs measure engineering and plant services — PPM completion, breakdown rates, statutory inspections — while soft FM KPIs measure people-delivered services like cleaning, security and reception, usually through audit scoring rather than uptime data. Both feed into the same contract SLA but require different measurement methods.
Securing honest KPI reporting with Pulse Operations
Every KPI in this article depends on one thing: evidence that the work actually happened, not a report that says it did. Pulse Operations builds that evidence at the point of delivery — security and FM work orders, PPM schedules, helpdesk SLAs and compliance deadlines sitting in one platform instead of across a spreadsheet, a WhatsApp thread and a filing cabinet.
On the landmark West London development referenced above, that meant 152 checkpoints made photo-mandatory from day one, with every patrol logged against a GPS location and timestamp rather than a sign-in sheet nobody could verify after the fact. The same mechanism — a mandatory watermarked photo at every checkpoint, no QR or NFC tag involved — underpins Pulse Operations's photo-verified patrols service and its facilities and work orders module.
If your current KPI reports are built on trust rather than evidence, get a demonstration of how Pulse Operations's control room, compliance runway and client portal turn delivered-vs-contract into a number your client can check themselves — see pricing or book a tour to see it against your own sites.
Related Reading
- Contractor Management Software for Facilities (2026 Guide)
- CAFM Software for Facilities Teams: UK Buyer's Guide 2026
- Compliance Calendar Software for Buildings (UK Guide)
Add pulse-operations.co.uk as a preferred source on Google
Back to all insights